A Gold Producer Controls Neither Price nor Cost. It Can Still Control Profit.
A gold producer can run a profitable mine, hold a strong market position, and still not control its own profit. Revenue is denominated in one volatile price — gold. Costs are driven by another — oil. Profit is the gap between two numbers the company doesn’t set, and in a bad year both move against it at once.
This article works the problem through on a real producer’s reported numbers and real 2026 prices, month by month. The usual fixes fall short: selling forward signs away the best months and fixes only the revenue line; locking input prices by contract is mostly unavailable; doing nothing left the mine’s annualized profit run-rate swinging by ~$465 million inside eight months of 2026. The alternative is to treat both prices as insurable risks: exchange-traded options, a floor under the gold revenue and a ceiling on the fuel bill, at an indicative ~$28M a year, about 1.2% of revenue. Over January–October 2026 that structure pays back $59M and keeps every dollar of the record winter prices that a forward would have confiscated.
1. The problem: two dials you don’t own
The example is real. Lundin Gold runs a single mine — Fruta del Norte in Ecuador. In FY2025, reported in February 2026, it sold 503,330 ounces of gold (498,315 produced), booked $1.78 billion of revenue at an average realized price of $3,594/oz, produced at an all-in sustaining cost of $1,015/oz, and earned $792 million of net income. A profitable mine by any standard — and both numbers behind that profit still belong to the market.
The revenue dial is the gold price. Gold set a record of $5,595 on 29 January 2026 and traded $4,166 on 16 October — 25% off the record in nine months. The mine sells at whatever the exchange quotes that day.
The cost dial is oil. Brent averaged $64 in November 2025 and $105 in October 2026, crossing $110 on 21 October — a near-doubling in under a year. Fuel and power sit inside every ounce’s cost — trucks, excavators, generators, the mill.
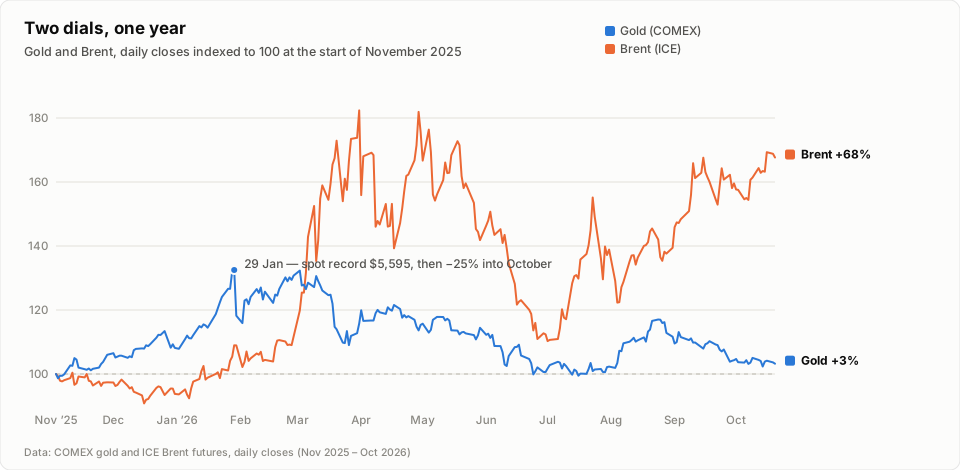
Neither dial answers to management. The dangerous year is the one where the gold price falls and the fuel bill rises at the same time — and 2026 has been exactly that year.
2. What are the options?
Option A — Sell forward, lock the price. The standard first instinct, and it has a real case.
- Pros: a known selling price you can budget and take to lenders; no premium out of pocket; clean.
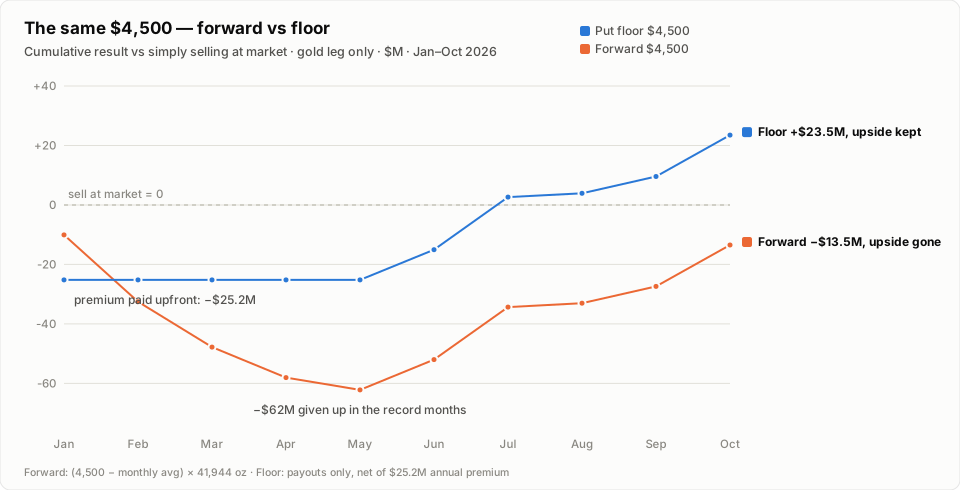
- Cons: you sign away the upside. Lock the year at $4,500 in the first days of January 2026 — roughly where gold then traded — and three weeks later the market prints its $5,595 record, $1,095 above the lock. Across January–May, when gold averaged $4,598–$5,036, the forward hands back $62M on Lundin’s volumes. The slide from June onward gives most of it back — over the ten months the lock nets out $13M behind simply selling at market — and it never touched the fuel bill. Financing drag compounds it: carrying the position costs 1–2% a year. A forward fixes only the revenue line, and in 2026 it fixed it at the wrong level.
Option B — Lock the inputs with long-term supply contracts. For most producers this door is mostly closed. Diesel and power are bought at local market rates; no supplier will hold a fixed price for twelve months for a mine. Where a power purchase agreement is available it is worth taking, but it covers a slice of the bill, not the structure.
Option C — Do nothing. Also has a case: in a falling market, unhedged you keep every dollar of the rebound. The bill for the other direction is in Section 4 — in 2026 it ran to almost half a billion dollars of annualized profit swing. It is also what the company itself does — Lundin’s filings state: “The Company has not hedged the price of any commodity at this time.”
3. The instrument: options — price insurance on gold and fuel
The problem has a fix, and it requires no view on where prices are going. The same markets that set the gold price and the oil price also sell contracts whose only job is to move price risk off a company’s books — the derivatives market. A producer can use it the way it uses insurance: pay a fixed, known fee today; if the market moves against the business, the contract pays out the difference. If it doesn’t, the fee was the whole cost.
The contracts are exchange-traded options. A put is the right, not the obligation, to sell at an agreed price: a floor under revenue. A call is the right to buy at an agreed price: a ceiling on a cost. Unlike the forward from Option A, neither obliges the company to give up the good outcome — they only pay when the bad one arrives.
Sized for Lundin’s full reported volume, with the book written in early January 2026:
- Gold — a floor under the revenue. Buy puts on the full annual sales volume — 503,330 oz, 41,944 oz settling each month — with the right to sell at $4,500/oz, roughly where gold traded when the book was written. Indicative fee: $50/oz — $25.2M a year. In months when gold averages above $4,500, the mine sells at the market’s price and the fee is the entire cost. In months below, every covered ounce pays back the difference.
- Fuel — a ceiling on the cost. Buy calls on Brent at $75 on the mine’s ~0.7M barrel-equivalent annual consumption, 58,333 barrels a month. Indicative fee: $2.5M a year. Every month Brent averages above $75, the difference comes back.
Total: $27.7 million a year, about 1.2% of revenue — a fixed, budgetable line, like any other insurance policy, with no bet on where gold or oil goes next. (Fees are indicative model levels; option prices move with market volatility.)
4. What the swing costs, unhedged
Nothing below is a forecast — these are 2026’s actual monthly averages, computed from daily futures closes (COMEX gold, ICE Brent).
Revenue in gold. February averaged $5,036; October $4,168 — 17% lower. On 41,944 oz sold a month, monthly revenue fell from $211M to $175M: −$437M annualized.
Costs through oil. Brent averaged $65 in January and $105 in October. On ~0.7M barrels of fuel equivalent a year — energy is roughly a quarter of the mine’s $422M cash operating cost; Lundin does not break out fuel, a quarter is the industry’s typical share — the energy line adds +$28M annualized.
Profit. Between February’s shape and October’s shape, the same mine’s profit run-rate moved ~$465 million annualized — 59% of FY2025 net income — with the same ounces, the same grades, the same mine plan.
5. What the hedge returned, month by month
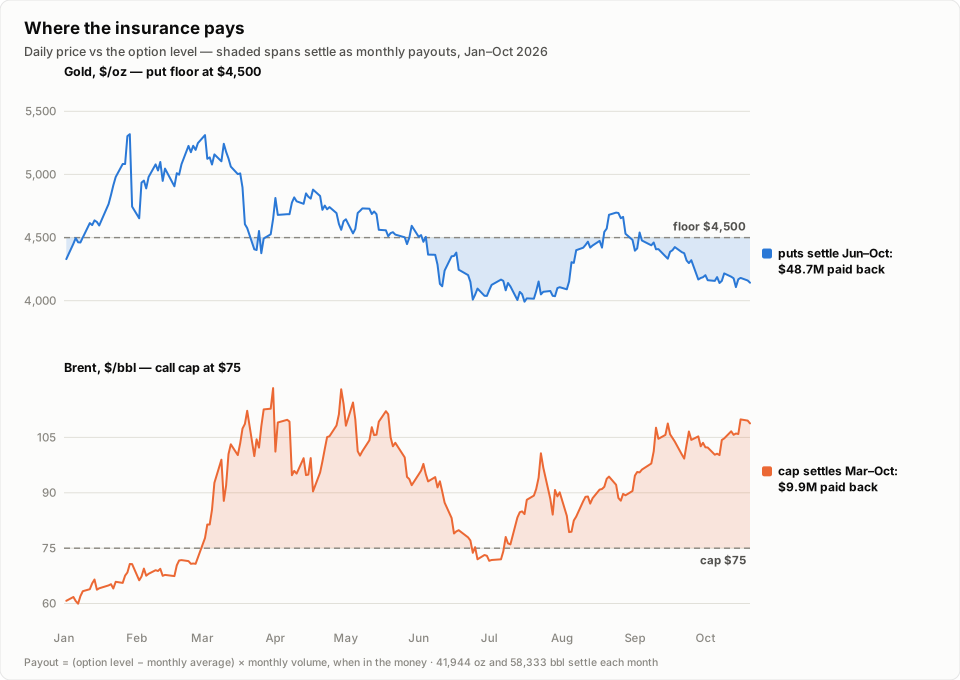
Same ten months, with the Section 3 book in place. Per-month payout = (strike − monthly average) × monthly volume, when positive:
| Month 2026 | Gold avg, $/oz | Put payout, $M | Brent avg, $/bbl | Cap payout, $M | Total, $M |
|---|---|---|---|---|---|
| Jan | 4,740 | — | 65 | — | — |
| Feb | 5,036 | — | 69 | — | — |
| Mar | 4,864 | — | 100 | 1.4 | 1.4 |
| Apr | 4,744 | — | 102 | 1.6 | 1.6 |
| May | 4,598 | — | 104 | 1.7 | 1.7 |
| Jun | 4,258 | 10.2 | 85 | 0.6 | 10.8 |
| Jul | 4,079 | 17.7 | 85 | 0.6 | 18.3 |
| Aug | 4,469 | 1.3 | 88 | 0.8 | 2.1 |
| Sep | 4,365 | 5.6 | 102 | 1.6 | 7.2 |
| Oct (to 20th) | 4,168 | 13.9 | 105 | 1.7 | 15.6 |
| Total Jan–Oct | $48.7M | $9.9M | $58.6M |
Ten months in: $58.6M paid back against $27.7M of annual premium. The June–October gold slide came back as $48.7M of put settlements; the oil spike as $9.9M from the cap. And the winter months stayed untouched — the mine sold January–May at $4,598–$5,036, prices the Option A forward would have signed away for $62M.
That is the asymmetry the premium buys: the same $4,500 level held as a forward “saves” the identical $48.7M on the slide but confiscates the record months; held as a floor, it saves the slide and keeps the rally.
Grade, permitting, recovery and production misses are not price risks — leave them unhedged. The gold price and the fuel bill are. Hedge those two, and the board stops betting the margin on which quarter the price slide and the cost spike arrive in.