Hedging GPU Rental Costs with Listed Futures: A Step-by-Step Guide
Sometime after November 9 — pending the CFTC’s extended review, announced September 22 — CME Group is expected to list cash-settled futures on Silicon Data’s H100 and B200 rental indices. The underlying has made the case for the product on its own: the H100 index printed $2.00/hour in December 2025 and $2.88 in October 2026, a 44% move in ten months. When trading opens, the largest input cost in AI gets its first regulated, exchange-traded hedge.
This guide walks through the contract and a complete worked example: a hypothetical company, its exposure, the position, the entry costs, and the P&L under a rising and a falling index. Every number follows from a formula shown next to it, so you can rerun the whole thing on a calculator. We run a desk that writes OTC compute strips; the framing and the judgment calls are ours, the arithmetic is yours to check.
Contract specifications
Two contracts list on NYMEX: GPU1 on Silicon Data’s H100 rental index and GPU2 on the B200 index. One contract is 730 GPU-hours — a single GPU running for one month — and it settles in cash against the monthly average of the index rather than a single print, with the last business day of the contract month as the final trading day. CME plans 36 consecutive monthly contracts, so day one arrives with a published three-year curve. Listing is pending CFTC review and comes no earlier than November 9, 2026.
Two of those specs matter more than they look. The monthly-average settlement means no single bad print on expiry day decides your outcome — the settlement value accrues across the month, the same way your rental invoice does. And the 730-hour unit does the position math for you: a book kept in GPU-months is a book anyone in the building can audit.
The index families track neocloud on-demand rates. Keep that in mind for Step 5.
The worked example, up front
Everything below runs through one hypothetical company with illustrative prices. It is not a client, and the numbers are chosen for clean arithmetic, not taken from any real account.
The setup: an inference company runs 40 H100-class GPUs steady-state, 24/7, at a neocloud provider. The provider bills the index plus a $0.10/hour basis premium — the contractual spread for their network, support and terms. The spot index is $2.88/hour. The company wants cost certainty for the next 12 months.
Step 1: Measure your exposure
Count GPU-hours first, dollars second.
- Annual GPU-hours: 40 GPUs × 730 hours/month × 12 months = 350,400 GPU-hours
- Current all-in rate: $2.88 index + $0.10 basis = $2.98/hour
- Annual run-rate at today’s spot: 350,400 × $2.98 = $1,044,192
Write the basis down as a named number — here, +$0.10/hour. It is the part of your rate the futures market will never see, and it reappears in Step 5.
Step 2: Size the position
Hedge the floor of your forecast, not the plan. Cover the usage that survives a pessimistic demand scenario; a 100% hedge of an optimistic forecast is not a hedge — it is a long position wearing a hedge’s paperwork.
Our company’s floor is 70% of the fleet:
- Contracts per month: 40 GPUs × 0.70 = 28 contracts
- Total position: 28 contracts × 12 months = 336 contracts (a 12-month strip)
- Hedged hours: 336 × 730 = 245,280 GPU-hours
- Left floating by design: 350,400 − 245,280 = 105,120 GPU-hours (12 GPUs)
Revisit the ratio on a calendar — quarterly against the demand forecast — not on a market view.
Step 3: Price the entry
Assume the 12-month strip is quoted from $2.70/hour in the front month sliding to $2.20 in month 12 — an average locked price of $2.45/hour. Illustrative, but the shape is deliberate: forward curves in this market have shown backwardation — futures below spot — even while spot was rallying. On September 7, Silicon Data’s reserve-contract data implied a forward rate of $2.08/hour for months 7–12 against a $2.63 spot index. A $2.45 lock under a $2.88 spot is a plausible day-one curve, not a discount.
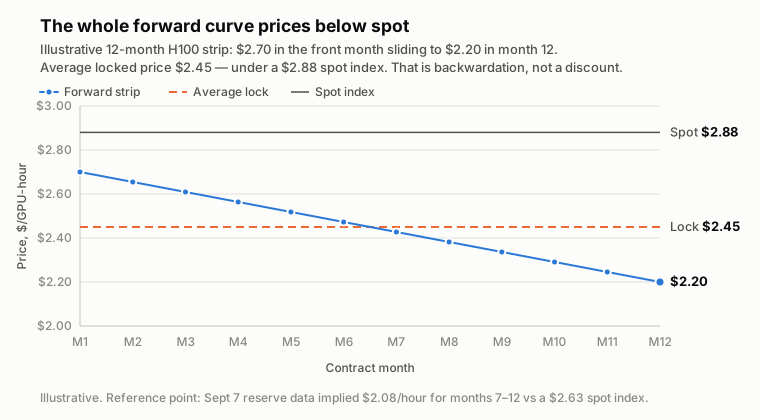
Figure 1: The entry price is the shape of the curve, not a discount — every month of the strip prices below the $2.88 spot, and the $2.45 lock is their average.
Entry costs, itemized:
- Notional: 245,280 hours × $2.45 = $600,936
- Initial margin: assumption — final margins are set by the clearinghouse and were not published at the time of writing. At ~10% of notional, budget roughly $60,000 of cash collateral.
- Exchange fees: 336 contracts × $5.50 = $1,848 (non-member rate)
- For scale: one minimum tick ($0.01/hour) moves each contract by $7.30, so the 28-contract monthly line moves $204.40 per tick.
A future costs no premium. It costs margin in cash and daily settlement against the mark — treasury, not expense.
Step 4: Run both scenarios
Settlement is against each month’s index average. For arithmetic, assume the index averages the same level every month of the year — $3.10 in the up-scenario, $2.20 in the down-scenario.
| Index averages $3.10 | Index averages $2.20 | |
|---|---|---|
| Provider invoice, full fleet: 350,400 × (index + $0.10) | 350,400 × $3.20 = $1,121,280 | 350,400 × $2.30 = $805,920 |
| Futures settlement P&L: 245,280 × (index − $2.45) | 245,280 × $0.65 = +$159,432 | 245,280 × (−$0.25) = −$61,320 |
| Net cash cost, full fleet | $961,848 | $867,240 |
| — of which: hedged 28 GPUs (245,280 h) | $784,896 − $159,432 = $625,464 | $564,144 + $61,320 = $625,464 |
| — of which: unhedged 12 GPUs (105,120 h) | 105,120 × $3.20 = $336,384 | 105,120 × $2.30 = $241,776 |
| Effective rate on hedged hours | $2.55/hour | $2.55/hour |
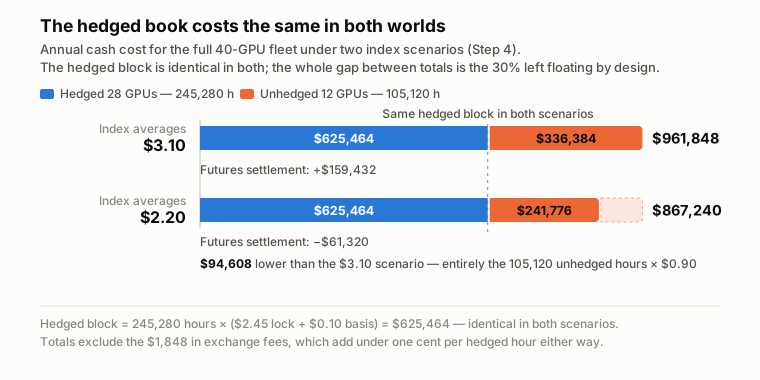
Figure 2: The hedged book costs the same in both worlds. The $94,608 separating the two totals is entirely the 30% left floating.
Read the table’s fourth row twice. The hedged book costs $625,464 in both worlds — exactly 245,280 hours × ($2.45 lock + $0.10 basis) = 245,280 × $2.55. The index went to $3.10 or to $2.20 and the hedged cost did not move a dollar. Adding the $1,848 in fees brings it to $627,312 either way — under one cent per hedged hour.
The two bottom lines of the full fleet differ by $94,608 — which is precisely 105,120 unhedged hours × the $0.90 gap between scenarios. That is not hedge slippage; it is the 30% the company chose to leave floating in Step 2.
One honest note on the down-scenario: an unhedged competitor pays $2.30/hour that year while our company’s hedged book pays $2.55. That $0.25 is the price of certainty, paid in the year rates fell, after being earned in the year they rose. If that trade-off reads as a loss rather than an insurance premium, the program will be abandoned at the first soft quarter — decide which reading your CFO holds before the first contract, not after.
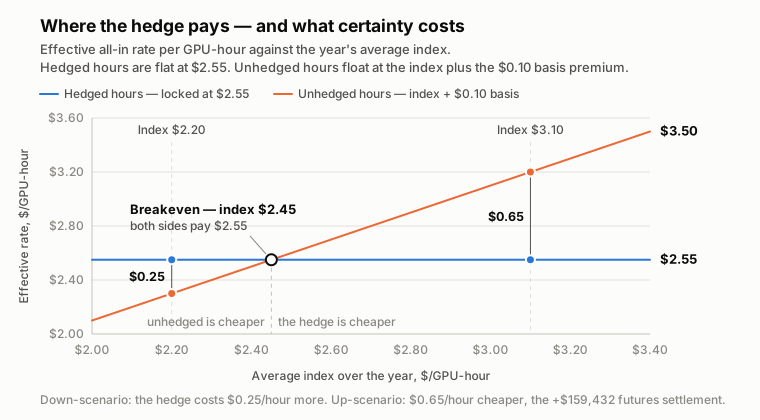
Figure 3: Breakeven sits at a $2.45 average index. Above it the hedge pays; below it, the $0.25/hour gap in the down-scenario is the whole price of certainty.
Step 5: Know what the hedge does not do
It does not hedge the basis. The $0.10/hour provider premium sits outside every futures settlement. If the provider renegotiates it to $0.20 at renewal, that is 350,400 × $0.10 = $35,040/year of new cost no futures position offsets. Hedging protects you from the macro cycle, not from your own contract.
It does not settle against a hyperscaler bill. The indices track neocloud on-demand rates. If your invoice reads AWS or Google, the future hedges a correlated cousin of your cost, not the cost itself. March’s repricing wave — Alibaba up to 34%, Baidu 5–30%, AWS and Google breaking a multi-year freeze — suggests the correlation is real, and a dirty hedge against a 44% move still beats a clean nothing. But size it knowing it is dirty.
Margin calls are mechanics, not catastrophe. In the falling scenario, the futures position is debited $61,320 across the year in daily variation margin. In the same months, the invoice on those hedged hours comes in $0.25/hour cheaper — the identical $61,320. The cash leaves through the margin account and comes back through the payables line; the only requirement is that the buffer exists before the first adverse week, not during it.
Step 6: De-hedge on rules, not opinions
If the workload behind a contract goes away, the contract closes — same sizing arithmetic in reverse, no view on where rates go next. Keeping a profitable hedge on after its reason has left is how hedging programs quietly become prop desks. Write the exit rules the day you write the entry ticket.
The other side of the trade
Every contract our hypothetical company buys, someone sells. The structural seller is whoever owns a GPU fleet and earns floating rental revenue — a neocloud locking in revenue per GPU-month is running the producer hedge every physical commodity market is built on. Silicon Data’s own provider guide puts it plainly: the natural party for the term-structure trade is a provider who already owns capacity and prices it across terms every day.
The backwardated curve is consistent with that: fleet owners selling forward to lock revenue push deferred prices below spot, which is exactly what makes the buyer’s lock in Step 3 land at $2.45 under a $2.88 index. Both sides of this market have a reason to show up.
What comes after the CME listing
The CME contract is the opening, not the whole market. ICE and Ornn’s HPR (H100) and BKL (B200) on ICE Futures US — cash-settling on Ornn’s Compute Price Index — sit in the same CFTC review. Nodal Exchange and Compute Desk announced contracts on September 3, and Architect, whose offshore perpetuals have traded in Bermuda since January, bought a US-regulated exchange in May. On the fund side, GraniteShares and Corgi filed with the SEC in September for ETFs wrapping the H100/B200 futures — filings only, no tickers or launch dates, and not to be confused with GCPU or NCLD, which hold AI-infrastructure equities rather than GPU-hour price exposure.
For a hedger, none of that changes the workflow above. The arithmetic in Steps 1–6 fits on one spreadsheet tab; build it before the first session, not during it.
The company, prices and curve in this guide are hypothetical and illustrative; margin figures are assumptions, as final requirements are set by the clearinghouse. This is not financial advice. Listing dates are subject to regulatory review and have moved before; contract specifications may change before launch. Statements about future listings and ETF launches are forward-looking expectations, not guarantees.